Why your online shop might be losing sales – and how you can change that
Anyone who runs an online shop puts a lot of effort into advertising, product management and fulfilment. Analysing their own shop data often falls by the wayside. Many retailers don’t know at which stage customers drop out, and so lose revenue day after day without realising it. Traditional analytics tools such as Google Analytics often only capture a fraction of visitors due to cookie consent banners.
In this article, we present three key metrics that every shop owner should keep an eye on. We also show you how to use cookie-free tracking to get the full picture of your shop’s visitors, with no technical effort required.
In day-to-day business, analysing shop performance often takes a back seat for many retailers. Some use Google Analytics because it’s free. Others do without an analytics tool altogether. Both groups face a similar problem: they don’t know exactly what’s happening in their shop.
Where do visitors come from? At what point do they leave the shop? Why do they abandon their purchase? Without answers to these questions, it’s almost impossible to assess, for example, whether advertising spend is worthwhile. If a traditional cookie-based analytics tool is used, the dashboard usually only shows 60–70% of actual visitors, because the rest reject the cookie banner.
Three key metrics that directly influence your turnover
Conversion Rate
The conversion rate indicates the proportion of your visitors who actually complete a purchase. In e-commerce, the average is 1–3%. If your figure is significantly lower, you should take a closer look. Common causes include unclear delivery costs or long loading times. Without knowing this metric, it is difficult to assess the success of your advertising efforts.
Shopping basket abandonment rate
Almost 70% of all online shopping baskets are abandoned before purchase. This means that seven out of ten customers add a product to their basket and then leave the shop. The crucial factor is at which stage customers drop out. Only with this information can you optimise your strategy effectively.
Traffic sources
Visitor numbers alone tell us little. A hundred visitors from a targeted campaign can generate more revenue than a thousand from a less suitable source. If you know which channels bring paying customers to your shop, you can allocate your marketing budget accordingly. Precisely because many online retailers do not have a large budget for this, it makes a significant difference.
The cookie problem with conventional analytics tools
Most analytics tools use cookies to track visitors. In this case, the GDPR requires a consent banner. A significant proportion of visitors click ‘Decline’ or ignore the banner. These visitors do not appear in the analytics overview.
This skews your data. The conversion rate displayed is based on incomplete traffic. Around a third of visitors are missing from the traffic sources. Yet you make decisions about your advertising budget based on this. In the worst-case scenario, this incomplete data is more misleading than no data at all.
The Trackboxx software provides you with the most important statistics relating to your shop – and it does so without cookies
Shop analytics with Trackboxx
Trackboxx is a German analytics platform developed specifically for online retailers. The software operates entirely without cookies and can be integrated into your ePages shop in just a few clicks.
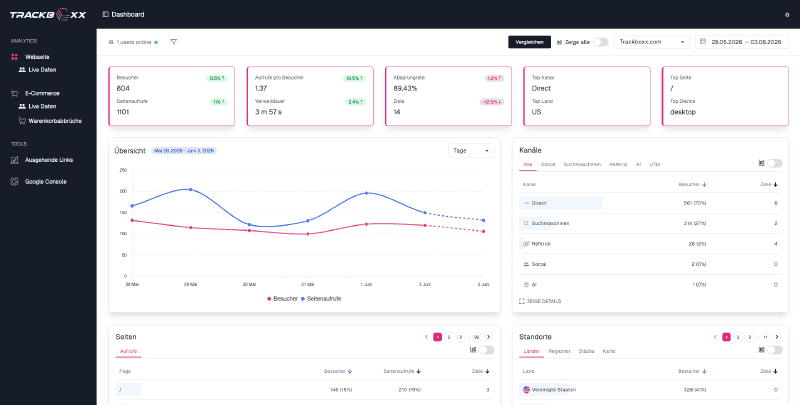
Once set up, the key e-commerce metrics are immediately available to you: turnover, conversion rate, abandoned baskets and traffic sources. As Trackboxx operates without cookies, you can view data for all visitors – including those who would have rejected a cookie banner. An additional consent banner for analytics is not required.
The dashboard is deliberately kept clear and concise. At a glance, you can see where your visitors come from, what they do in your shop and at which point potential buyers abandon the process. All data is hosted on European servers and processed in compliance with the GDPR. Consequently, no data is transferred to third countries.
Trackboxx can be run alongside Google Analytics or used as a standalone solution. Retailers who find Google Analytics 4 too complicated or who have incomplete data due to cookie consent gaps will particularly benefit from the easy setup. After installation via the ePages App Store, the first reports are available within minutes.
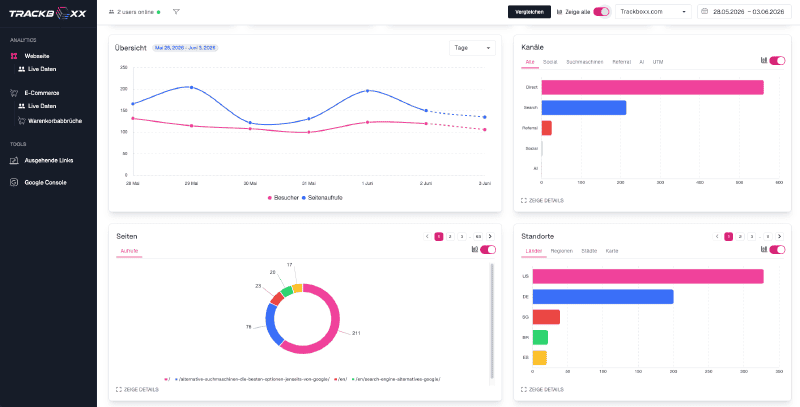
In the Trackboxx app dashboard, you can see not only visitor numbers and page views but also the channels through which visitors reached your shop.
Try it for free now
Every day without reliable shop data potentially costs you revenue. Trackboxx offers a free trial so you can check your shop’s data before deciding on a subscription. You can find the Trackboxx app in the admin area of your ePages Now shop in the App Store under Statistics. Set-up takes less than five minutes. For further information, visit trackboxx.com.